

Manufacturing Control Center
A representative Industry 4.0 platform designed to centralise production, quality, maintenance and operational intelligence into a single enterprise environment.
- Estimated timeline
- Typically 12–18 weeks for a first production module
- Platforms
- Web · Mobile · Cloud
- Tech stack
- Next.js · Laravel · PostgreSQL · MQTT
The business scenario
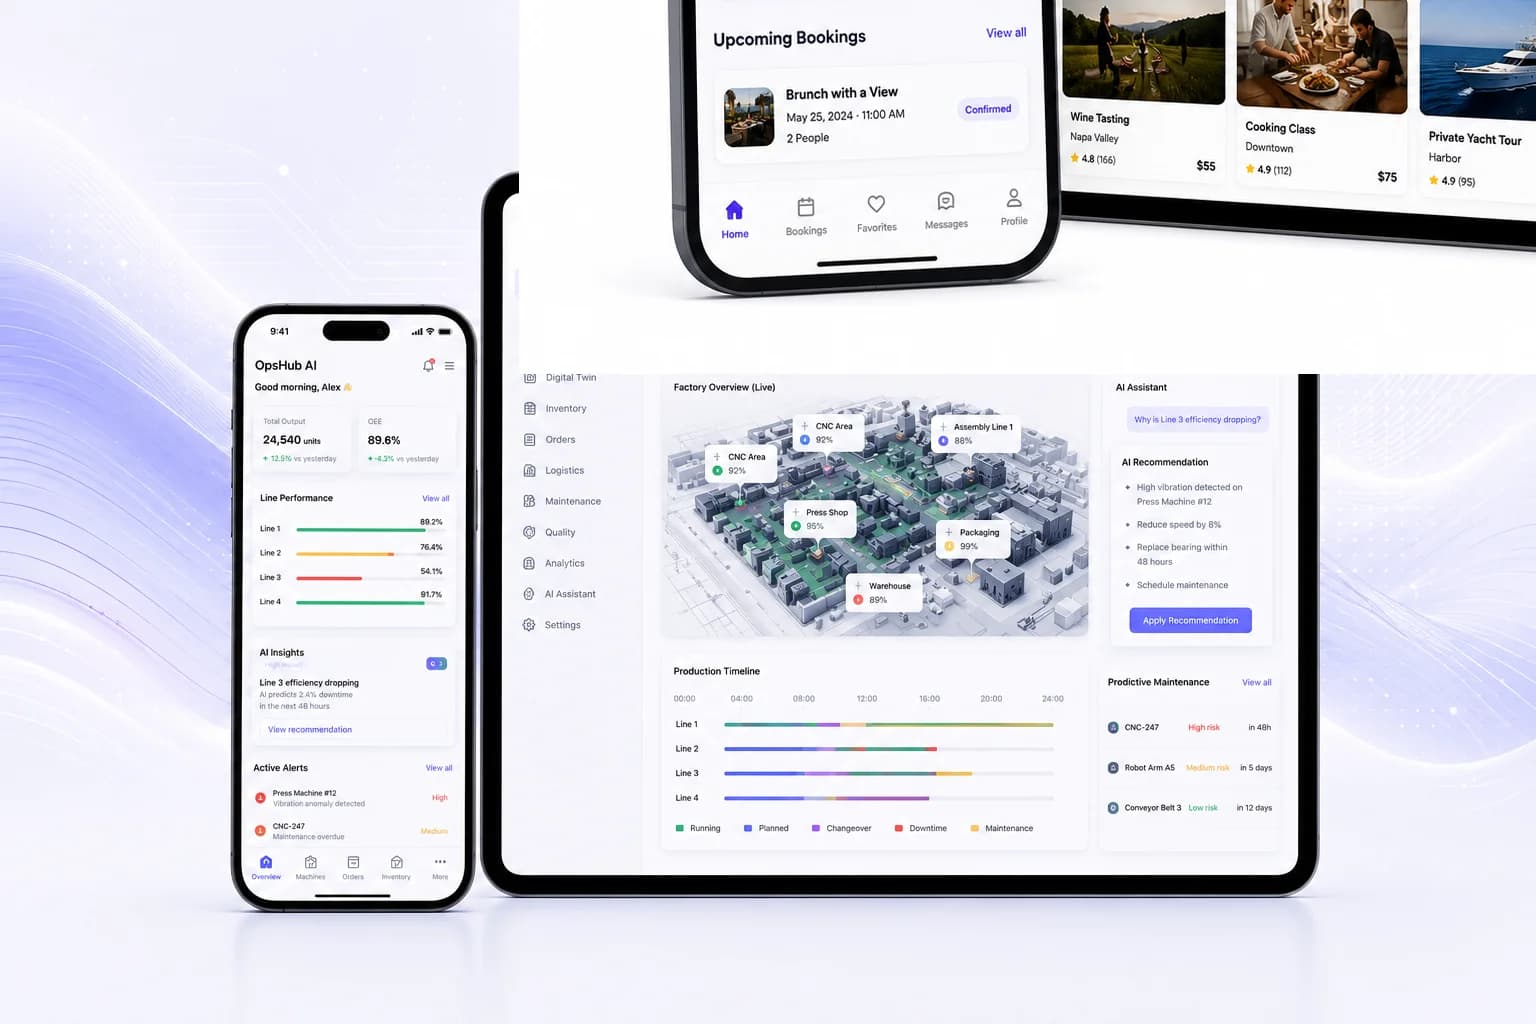
A manufacturing company running several production lines typically ends up with production tracked in one system, maintenance logged in another, inventory managed in a spreadsheet, and quality inspections recorded on paper. Each line has visibility into its own state, but nobody has visibility into the plant as a whole — machine downtime is discovered after it happens, maintenance is scheduled reactively, and a quality issue on one line doesn't surface as a pattern until it's already repeated on another.
This Representative Solution demonstrates one possible architecture for solving that class of problem — a cloud-native platform that unifies production, maintenance, inventory, quality, and scheduling behind a single operational environment, with machine data flowing in through an IoT gateway rather than being read off a gauge by hand. It is not a real client deployment. It is a reference implementation showing the engineering approach we would bring to an industrial project like this.
The problems this platform responds to
The operational reality behind most enterprise software investments — not a single failure, but friction compounding across systems and teams.
How the platform addresses it
The platform centralizes plant operations behind a single environment — real-time production and machine monitoring, maintenance planning grounded in actual equipment condition, and quality control connected to the same data model as everything else, with separate views for operators on the floor and management overseeing the plant.

Production Dashboard

Machine Monitoring
Maintenance Planning
Quality Control
Inventory

Analytics
Operator Portal
Management Dashboard
What's included
The feature set that makes the solution overview concrete — each one a real, scoped piece of the platform, not a roadmap aspiration.
How the system is structured
A layered architecture connecting the shop floor to the applications operators and management actually use — machine data flows up through a dedicated IoT gateway rather than being mixed directly into the application layer.
- 01
Production Dashboard
The web and mobile interfaces operators, supervisors, and management interact with directly.
Next.jsReact - 02
API Layer
A single entry point handling authentication, rate limiting, and request routing to the services behind it.
AuthRate limitingRouting - 03
Business Services
The core business logic — production tracking, maintenance, quality, scheduling — as independently deployable services.
Node.jsLaravel - 04
IoT Gateway
A dedicated layer ingesting machine and sensor data from the plant floor, decoupled from the application services.
MQTTSensorsEdge devices - 05
Database
The system of record for production, maintenance, and quality data, structured for the query patterns the platform runs.
PostgreSQLRedis - 06
Analytics
A metrics pipeline feeding plant-wide reporting and dashboards from the same underlying event data.
Metrics pipelineReporting - 07
Monitoring
Logging, error tracking, and health checks across every layer, so issues surface before they affect production.
LoggingAlertsHealth checks
Built on a modern, production-grade stack
Every technology here is a deliberate choice, not a default.
How we approached the build
- Reliability First
A production platform can't go down during a shift. The architecture is built around graceful degradation, not just uptime targets.
- Scalable Architecture
Adding a new line or plant means adding capacity, not re-architecting how the platform ingests and processes data.
- Industrial Integrations
The IoT gateway is built to speak the protocols real industrial equipment actually uses, not a simplified demo version.
- Long-term Maintainability
Clear service boundaries mean a new engineer can understand and extend one module without needing to understand the entire plant floor integration first.
What this architecture is designed to achieve
This kind of platform is designed to change how a plant operates day to day — not to hit a specific number, but to remove the blind spots that make production, maintenance, and quality reactive instead of planned.
Improved production visibility, with real-time status across every line instead of walking the floor to find out.
Reduced operational complexity, as production, maintenance, inventory, and quality run through one platform instead of five disconnected tools.
Better maintenance planning, grounded in actual equipment condition rather than a fixed calendar or a breakdown.
Centralised industrial information, replacing paper inspection logs and per-line spreadsheets with one system.
Scalable manufacturing platform, since the modular architecture lets new lines and plants be added without a rebuild.
Frequently asked questions
More representative solutions
Other reference architectures from the same Representative Solutions collection.
AI Operations Platform
Smart Logistics Hub
Business Automation Suite
Enterprise CRM
Technologies we build this on
The stack pieces most relevant to a project like this one.
Next.js Development
We build enterprise-grade web applications with Next.js, combining the App Router, Server Components, and hybrid rendering to ship products that are fast, scalable, and built to grow.
Explore the stackNode.js Development
We build enterprise backend systems with Node.js — REST APIs, real-time applications, and event-driven microservices architected for concurrency, scalability, and high availability.
Explore the stackPostgreSQL Development
We design and operate PostgreSQL databases for enterprise software — schema design, replication, and partitioning architected around the domain's actual data integrity and scale requirements, not a generic reference schema.
Explore the stackServices that pair with this work
Other engineering disciplines projects like this one often need alongside it.
Business Automation
Automate repetitive processes, connect disconnected systems and eliminate manual work through intelligent workflows, integrations and AI-powered automation.
Explore the serviceAI Development
We design and build production-ready AI systems, LLM integrations, AI agents, RAG platforms, workflow automation and intelligent business software.
Explore the serviceCustom Software Development
We design and build custom business software engineered around your operations, not adapted from off-the-shelf products.
Explore the serviceRelated reading
Practical guides worth reading while you're scoping this kind of project.
Database Design for Enterprise Applications: A Practical Engineering Guide
Database design for enterprise applications is the discipline of structuring data models, schemas, and infrastructure so a system stays correct, fast, and maintainable as both the application and the organization grow. It covers relational and non-relational modeling, normalization and denormalization trade-offs, indexing and query performance, and the scaling patterns — partitioning, replication, caching — that keep a database healthy at real production load. Good database design is invisible when done well and expensive to fix when done poorly, which is why it deserves the same engineering rigor as any other part of the system.
Read the guideAPI-First Architecture for Enterprise Software
API-first architecture means designing and agreeing on an API's contract before writing the implementation behind it, so every client — web, mobile, partner integrations, AI systems — builds against a stable interface instead of whatever the backend happens to expose. This guide explains how that discipline is actually applied in enterprise systems, not the marketing version of the idea.
Read the guideHow to Build AI Agents for Enterprise Software
An AI agent extends a large language model with reasoning, memory, and the ability to call tools and take real actions inside business systems — this guide explains how agents are actually architected, deployed, and governed in production, not the marketing version of what an agent is.
Read the guidePurpose-built platforms in this space
Dedicated landing pages for the specific platforms we build most often.
Manufacturing Software Development Company
Industrial software and smart factory platforms that improve production efficiency and visibility.
See the solutionCustom ERP Software Development Company
Custom ERP platforms that centralise operations and connect every department on one scalable system.
See the solutionFor CTOs and technical leadership
Executive-level engagements for organisations planning at a larger scale.
Digital Transformation Consulting Services
Helping enterprise leaders modernise legacy systems and build digital products through disciplined engineering.
Explore the programLegacy Software Modernization Consulting
A structured engineering approach to modernising legacy software while cutting migration risk.
Explore the programLet's build your next manufacturing platform.
Whether you're connecting the plant floor, centralising quality and maintenance, or modernising legacy production systems, we'll help you architect it right.
No sales pressure. Just a direct technical conversation.